What is CRO? Cathode Ray Oscilloscope: Working, Diagrams, Formulas, Calibration & Safety
Complete CRO guide CRT working principle, key components, deflection sensitivity, bandwidth formula, Lissajous figures, step-by-step tutorial, troubleshooting, IEC 61010 safety & CRO vs DSO comparison.
🎯 Key Takeaways
- ✅ A CRO (Cathode Ray Oscilloscope) is a precision instrument that displays electrical signals as visible waveforms on a phosphor screen using a focused electron beam inside a vacuum tube (CRT)
- ✅ Deflection Sensitivity: S = D/V (mm/V) measures the vertical displacement per unit input voltage; set by the Volts/Div knob
- ✅ Bandwidth and Rise Time: BW ≈ 0.35 / tr a CRO with 20 MHz bandwidth can accurately measure signals with rise times above 17.5 ns
- ✅ Frequency measurement: f = 1/T count horizontal squares for one cycle, multiply by Time/Div to get T, then calculate frequency
- ✅ X-Y Mode and Lissajous Figures enable precise frequency ratio and phase angle measurement between two signals without a time base
- ✅ Safety standard: IEC 61010 governs all measurement instrument safety; IEEE Std 1057 governs accuracy and calibration procedures
- ✅ CRO vs DSO: CRO is analog, up to ~100 MHz, real-time display, excellent for education. DSO is digital, >1 GHz, stores waveforms, preferred in industry
- ✅ Always compensate your probe using the built-in square wave calibration signal before taking high-frequency measurements uncompensated probes cause overshoot and rounding errors
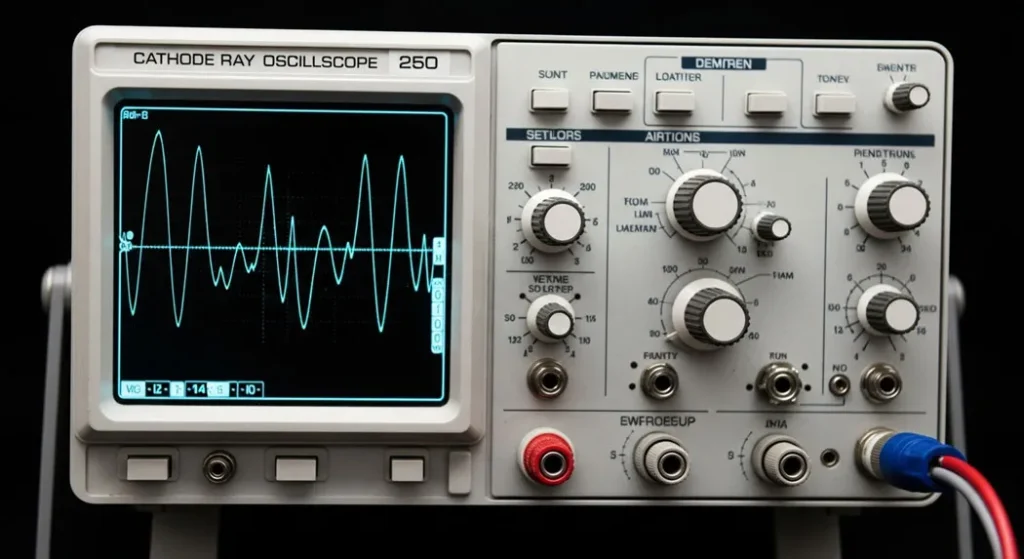
Fig 1. A Cathode Ray Oscilloscope (CRO) the classic analog measurement instrument that displays electrical signals as visible waveforms. Despite digital oscilloscopes becoming dominant, the CRO remains a cornerstone of electronics education and analog signal analysis.
What Every Electronics Student Must Know About CROs
A CRO’s bandwidth determines which signals it can accurately display. The rule: BW ≈ 0.35/tr. A 20 MHz CRO cannot accurately show signals with rise times below 17.5 ns it will artificially round their edges, giving wrong amplitude readings.
Without correct triggering, no useful measurement is possible the waveform continuously drifts across the screen. Always set trigger source, level, and slope before attempting any measurement. Edge triggering on the signal’s rising edge is the most common starting point.
An uncompensated 10× probe introduces capacitive mismatch that rounds square wave edges and distorts high-frequency signals. Always compensate using the CRO’s built-in square wave signal at startup it takes 30 seconds and eliminates a major source of measurement error.
Lissajous figures in X-Y mode provide the most accurate phase difference measurement available from a CRO more precise than comparing two channels visually. An ellipse with a Y-intercept of ½ the maximum deflection indicates exactly 30° phase difference.
The CRO probe ground clip must connect to the circuit’s ground reference never to mains earth alone. Floating grounds cause incorrect waveform display and can create dangerous current paths. In floating circuits, use differential probes.
Never use a CRO or DSO not rated for your measurement category (CAT I–CAT IV). Mains-connected circuits require at minimum CAT II. Using a CAT I instrument on mains voltage violates IEC 61010 and creates serious electrocution risk.
What is a Cathode Ray Oscilloscope (CRO)?
A cathode ray oscilloscope (CRO) is a precision electronic test instrument that converts electrical signals into visible waveforms on a phosphor screen allowing engineers, technicians, and students to observe, measure, and analyze the behavior of electrical circuits in real time. Think of it as a television for your circuits: instead of showing video, it shows you how voltage changes over time, drawing continuous graphs of signal behavior.
At its core, a CRO uses a Cathode Ray Tube (CRT) a vacuum tube that fires a focused beam of electrons toward a phosphor-coated screen. The electron beam moves horizontally at a controlled rate (the time base) while the vertical position responds to the input signal voltage. The result is a glowing trace on the screen the voltage-versus-time waveform of your signal. The cathode ray oscilloscope was named after this core component.
Table of Contents
- → What is a Cathode Ray Oscilloscope? Why Should You Care?
- → How Does a CRO Work? The Cathode Ray Tube Principle
- → The Heart of the CRO: Cathode Ray Tube (CRT) Anatomy
- → Key Parts of a CRO: Inside the Instrument
- → A Peek at the CRO’s Front Panel Controls Explained
- → Quantitative Formulas and Worked Examples
- → Case Studies: Lissajous Figures, X-Y Mode & Advanced Measurements
- → CRO vs. Modern Oscilloscopes Full Comparison
- → How to Use a CRO: Complete Beginner’s Tutorial
- → What Can a CRO Measure?
- → Applications of a Cathode Ray Oscilloscope
- → Troubleshooting, Calibration & Industry Standards
- → Tips for Using a CRO Like a Pro
- → The History of CROs: Karl Braun to Digital Scopes
- → Getting Started with Your Own CRO
- → Frequently Asked Questions About CROs
What is a Cathode Ray Oscilloscope?
A cathode ray oscilloscope, or CRO, is a tool that lets you see electrical signals as pictures on a screen. Think of it as a TV for your circuits showing you how voltage changes over time. Whether you are a student in an electronics lab or a hobbyist fixing a radio, the CRO helps you understand what is happening inside your circuits by displaying signals as wavy lines called waveforms.
The term “CRO” stands for Cathode Ray Oscilloscope, named after its main component the Cathode Ray Tube (CRT) which creates the display. In electronics, a CRO is like a microscope for signals: it shows you their shape, size, and timing, helping you spot problems or confirm that everything is working as it should. The technology dates back to the late 19th century, with significant developments in the 1930s, making it a cornerstone in telecommunications, medical equipment testing, and audio engineering.
In modern contexts, while digital storage oscilloscopes (DSOs) have largely replaced traditional CROs due to portability and advanced features like waveform storage and mathematical analysis, the classic CRO remains a fundamental educational tool for understanding analog signal visualization. Its value lies precisely in its simplicity it shows the “raw” signal without digital processing artifacts, making it ideal for learning.
Why Should You Care About CROs?
If you are working with electronics, a CRO is an indispensable diagnostic tool. It is used to:
- Check signal behavior in circuits like radios or amplifiers including observing RF modulation patterns to ensure proper transmission
- Find faults identifying clipping in amplifiers, ringing from impedance mismatches, or interference from electromagnetic sources
- Measure precisely using built-in graticule scales and cursors to calculate peak-to-peak voltage, period, phase differences, and rise times
- Learn electronics hands-on experiments visualizing sine waves, square waves, and RC circuit time constants build intuition that no textbook can replace
How Does a CRO Work? The Operating Principle
At its core, a CRO takes an electrical signal and turns it into a visible picture through a sequence of precisely engineered physical processes:
The operating principle is elegantly simple: the CRT fires a focused electron beam at a phosphor screen. The beam is simultaneously deflected vertically by the input signal voltage (through vertical deflection plates) and horizontally at a controlled rate by the time base generator (through horizontal deflection plates). The combined motion draws the voltage-versus-time waveform on the screen as a glowing trace.
The trigger circuit is what makes the display stable and useful it restarts the horizontal sweep at the same point in the signal every cycle. Without triggering, the waveform would drift continuously across the screen, making measurement impossible. Modern oscilloscopes offer edge, pulse width, video, and frequency triggering modes for complex signal analysis.
The phosphor coating determines the persistence of the trace glow longer persistence phosphors (P7: yellow-green) are useful for observing slow signals; shorter persistence (P31: green) prevents blurring of fast transients. Screen graticule markings (typically an 8×10 or 10×10 grid of 1 cm squares) provide the reference for all measurements.
The Heart of the CRO: CRT Anatomy
The Cathode Ray Tube is the defining component of a CRO it is what gives the instrument its name and its unique measurement character. Understanding the CRT anatomy helps you understand everything about CRO behavior, limitations, and proper use.
Electron Gun
The electron gun is the “cannon” of the CRO it creates, focuses, and accelerates the electron beam. The cathode is heated (either directly or indirectly) to a temperature at which electrons are emitted by thermionic emission. The control grid (a cylinder surrounding the cathode with a small hole) controls the intensity of the beam more negative voltage on the grid repels more electrons, reducing brightness. Focusing anodes use electrostatic lenses to converge the beam into a sharp point on the screen, producing a clear, thin trace. Accelerating anodes apply high voltage (typically 1–10 kV) to drive the electrons toward the screen at high velocity.
Deflection Plates
Two sets of parallel metal plates steer the electron beam:
- Vertical Deflection Plates (Y-plates): Connected to the vertical amplifier output. The input signal voltage creates an electric field between these plates, deflecting the beam up (positive voltage) or down (negative voltage) proportionally. This is the signal-encoding mechanism vertical position represents voltage.
- Horizontal Deflection Plates (X-plates): Connected to the time base generator output. A linearly increasing (sawtooth) voltage sweeps the beam from left to right at a controlled, uniform rate encoding time on the horizontal axis. In X-Y mode, an external signal replaces the time base for Lissajous figure generation.
Electrostatic deflection (used in most CROs) is faster than magnetic deflection (used in TVs) capable of responding accurately to signal frequencies up to the CRO’s rated bandwidth.
Fluorescent Screen
The inner face of the CRT is coated with a phosphor material that emits visible light when struck by electrons. Common phosphors: P31 (green, 28 µs persistence) for general purpose; P4 (white, short persistence) for photography; P7 (yellow-green, long persistence) for low-frequency signals. The screen graticule an 8×10 grid of 1 cm squares etched or printed on the front glass provides the measurement reference for reading voltage (vertical) and time (horizontal) values directly.
Key Parts of a CRO: What’s Inside?
Beyond the CRT, a complete CRO contains several critical subsystems that work together to produce stable, accurate, measurable waveform displays. Understanding each subsystem helps you use the instrument correctly and diagnose problems when the display is not as expected.
| Component | Function | Key Control | Engineer’s Note |
|---|---|---|---|
| Probes | Capture signal from test circuit the CRO’s hands | 1× / 10× attenuation switch | Active probes for high-frequency (>100 MHz) or high-impedance circuits |
| Vertical Amplifier | Boosts input signal to level that drives Y-deflection plates | Volts/Div knob, Position | Bandwidth of vertical amp determines CRO’s overall bandwidth rating |
| Attenuator | Reduces large signals before amplification to prevent clipping | Volts/Div (higher settings) | Must compensate probe capacitance see Section 12 |
| Time Base Generator | Creates linear sawtooth voltage to sweep beam left to right | Time/Div knob | Delayed sweep feature enables zooming into specific waveform portions |
| Trigger Circuit | Synchronizes sweep start with signal stabilizes display | Trigger Level, Source, Slope | Most critical setting incorrect trigger = unusable display |
| Horizontal Amplifier | Amplifies time base output to drive X-deflection plates | Horizontal Position | In X-Y mode, this amplifies the external X-input signal instead |
| Power Supply | Provides high voltage (kV) for CRT and low voltage for circuits | Power switch, warm-up time | |
| CRT (display) | Converts electron beam deflection into visible waveform trace | Brightness, Focus | Phosphor type determines trace color and persistence duration |
Pro Tip: Probe Loading Effect
Passive CRO probes have a typical input impedance of 1 MΩ || 15 pF (at 1×) or 10 MΩ || 12 pF (at 10×). In circuits with high source impedance or high-frequency signals, even this small capacitance loads the circuit altering the very signal you are trying to measure. For circuits above 100 MHz or source impedances above 1 kΩ, use active probes with FET input stages (input capacitance <1 pF). For differential measurements in floating circuits (like motor windings), use differential probes to eliminate common-mode voltage and ground loop errors.
A Peek at the CRO’s Front Panel Controls Explained
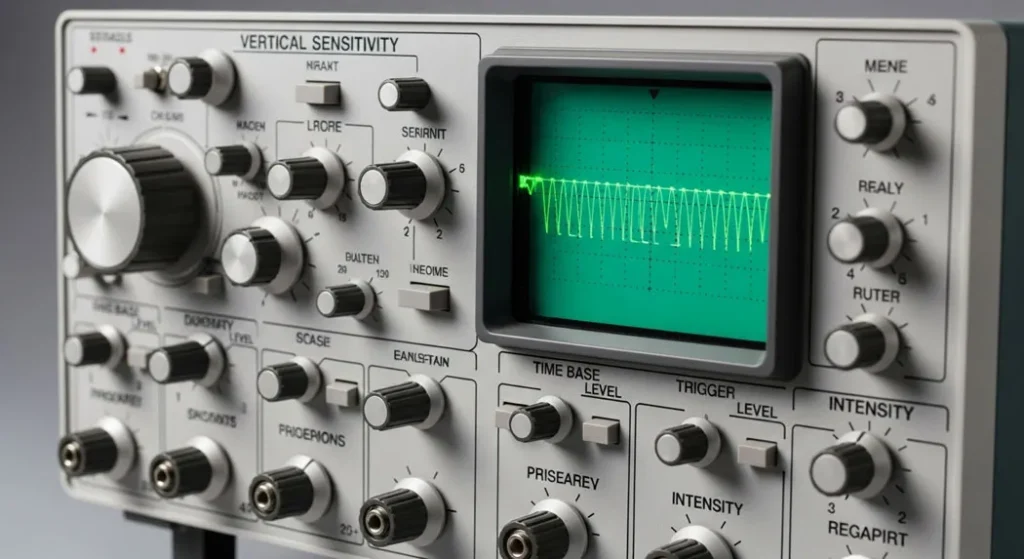
Fig 2. CRO front panel layout the main controls that determine how waveforms are displayed. Mastering these controls is the core skill of oscilloscope operation.
When you look at a CRO for the first time, the panel full of knobs and buttons can appear daunting. In reality, there are just a handful of critical controls you need to master the rest are refinements.
| Control | What It Does | Typical Setting to Start |
|---|---|---|
| Power Switch | Turns CRO on/off. Allow 1–2 min warm-up for older analog units. | ON wait for trace to appear |
| Brightness | Controls electron beam intensity brighter trace for dim rooms, dimmer for high-frequency signals to reduce phosphor burn | Mid-position to start |
| Focus | Sharpens the trace to a thin, clear line by adjusting electron lens voltage | Adjust until trace is thinnest |
| Volts/Div (V/div) | Sets how much voltage each vertical division represents. Lower = more sensitive (small signals); higher = less sensitive (large signals) | 1V/div as starting point |
| Time/Div (t/div) | Sets how much time each horizontal division represents. Determines how many signal cycles fit across the screen | 1ms/div as starting point |
| Position Controls (X, Y) | Move the trace up/down (Y) or left/right (X) to center it on the graticule for easier measurement | Center both axes |
| Trigger Level | Sets the voltage threshold at which the sweep starts determines where on the waveform the display locks | Mid-signal level; adjust until waveform stops moving |
| Trigger Source | Selects which channel (CH1, CH2) or external signal drives the trigger | CH1 (whichever channel you are measuring) |
| Channel Select | Enables CH1, CH2, or both (DUAL mode for phase comparison) | CH1 for single-channel measurement |
| Input Coupling | DC: shows full signal including DC offset. AC: blocks DC, shows only AC component. GND: disconnects input, shows ground reference line | AC for most signal work; DC for DC offset measurements |
Quantitative Formulas and Worked Examples
A CRO is not just a visual tool it is a precision measurement instrument defined by key performance equations. These formulas translate the graticule readings into quantitative electrical measurements.
V = Input voltage (Volts) | Set via the Volts/Div control
Higher sensitivity = larger deflection per volt = better visibility of small signals
Example: At 2 V/div with 10 mm/div graticule: S = 10mm / 2V = 5 mm/V
To find T: count horizontal squares for one complete cycle, multiply by Time/Div setting
Example: 5 squares at 1 ms/div → T = 5 × 0.001 = 0.005 s → f = 1/0.005 = 200 Hz
This is the -3 dB bandwidth of a single-pole (RC) frequency response model
Rule: A CRO can accurately measure signals with rise times > 3× its own rise time limit
Example: BW = 20 MHz → tr = 0.35/(20×10⁶) = 17.5 ns minimum measurable rise time
Probe attenuation: 1× probe = ×1, 10× probe = ×10 (must account for probe setting!)
Example: 4 divisions at 2V/div with 10× probe → Vpp = 4 × 2 × 10 = 80 V
Bandwidth Limitation Calculation
Problem: A CRO has a bandwidth of 20 MHz. Calculate: (a) its rise time limit, and (b) whether it can accurately measure a pulse with 10 ns rise time.
Solution (a) Rise time limit:
tr = 0.35 / BW = 0.35 / (20 × 10⁶) = 0.35 / 20,000,000 = 17.5 × 10⁻⁹ s = 17.5 ns
Solution (b) Can it measure 10 ns?
The measured rise time will be: tr(measured) = √(tr(actual)² + tr(CRO)²) = √(10² + 17.5²) = √(100 + 306.25) = √406.25 ≈ 20.2 ns
The CRO will display 20.2 ns instead of the actual 10 ns a 102% error. This CRO cannot accurately measure this pulse. A minimum 100 MHz bandwidth CRO (3.5 ns rise time) would be required for acceptable accuracy.
Measuring Amplitude and Frequency from a CRO Screen
Scenario: A waveform on a CRO screen spans 4 vertical divisions at 2V/div setting, and one complete cycle occupies 5 horizontal divisions at 1 ms/div setting. Probe is set to 1×.
Peak-to-peak voltage: Vpp = 4 × 2V/div × 1 = 8 Volts
Period: T = 5 × 1 ms/div = 5 ms = 0.005 seconds
Frequency: f = 1/T = 1/0.005 = 200 Hz
This signal is a 200 Hz sine wave with 8 V peak-to-peak amplitude. Note: if the probe were set to 10×, the actual peak-to-peak voltage would be 80 V always confirm probe attenuation setting before recording measurements.
Case Studies: Lissajous Figures, X-Y Mode & Advanced Measurements
Real-World Case Studies and Applications
| Application | CRO Mode | What to Look For | Key Measurement |
|---|---|---|---|
| Education Labs RC Circuit | Y-T (normal) | Exponential charging curve after step input | Time constant τ = RC measure 63.2% voltage point |
| Amplifier Distortion Check | Y-T, dual channel | Input = clean sine; Output = clipped flat tops/bottoms | Clipping threshold voltage; harmonic content |
| Power Supply Ripple | Y-T, AC coupling | Ripple on DC rail at 100 Hz (full-wave) or 50 Hz (half-wave) | Ripple voltage Vpp; ripple factor γ |
| RF Testing X-Y Mode | X-Y (Lissajous) | Figure shape reveals frequency ratio and phase | Frequency ratio, phase angle φ |
| I-V Curve Display | X-Y (component testing) | Current vs voltage characteristic of diode/transistor | Forward voltage, breakdown voltage, saturation |
Lissajous Figures for Frequency and Phase Measurement
Operating the CRO in X-Y mode (bypassing the internal time base and applying signals to both axes simultaneously) creates Lissajous Figures geometric patterns whose shape precisely encodes the frequency ratio and phase relationship between the two signals.
Ntangent-Y = Number of times the Lissajous figure is tangent to a horizontal line
Ntangent-X = Number of times the figure is tangent to a vertical line
Example: Figure tangent to horizontal 3 times, vertical 2 times → fy/fx = 3/2
Xintercept = Width of the ellipse at Y = 0 (where it crosses the horizontal center line)
Xmax = Maximum width of the ellipse
Straight line at 45° → φ = 0° (in phase) | Perfect circle → φ = 90° (quadrature)
Straight line at 135° → φ = 180° (out of phase) signal paths must be equal length for accuracy
CRO vs. Modern Oscilloscopes Full Comparison
Fig 3. CRO vs DSO the classic analog CRO (left) uses phosphor screen and direct beam deflection; the modern DSO (right) samples signals digitally, enabling storage, advanced analysis, and GHz bandwidths
| Parameter | CRO (Analog) | DSO (Digital Storage) | MSO (Mixed-Signal) |
|---|---|---|---|
| Display Technology | Phosphor CRT screen | LCD / TFT color display | LCD with logic analyzer overlay |
| Bandwidth | Up to ~100 MHz | >1 GHz (typical) | >500 MHz |
| Waveform Storage | ❌ None real-time only | ✅ Internal + USB export | ✅ Extended memory |
| Signal Resolution | Infinite (analog) | 8–12 bit ADC | 8–12 bit ADC |
| Pre-trigger Capture | ❌ Not possible | ✅ Key feature | ✅ Yes |
| Math Functions | Limited | FFT, integration, multiply | Protocol decode + timing analysis |
| Logic Analysis | ❌ Not available | ❌ Not standard | ✅ 16+ digital channels |
| Price Range | $50–$500 (used) | $200–$50,000+ | $500–$100,000+ |
| Best For | Education, analog signal fundamentals | Industry, advanced signal capture | Embedded systems, firmware debug |
How to Use a CRO: Complete Beginner’s Tutorial
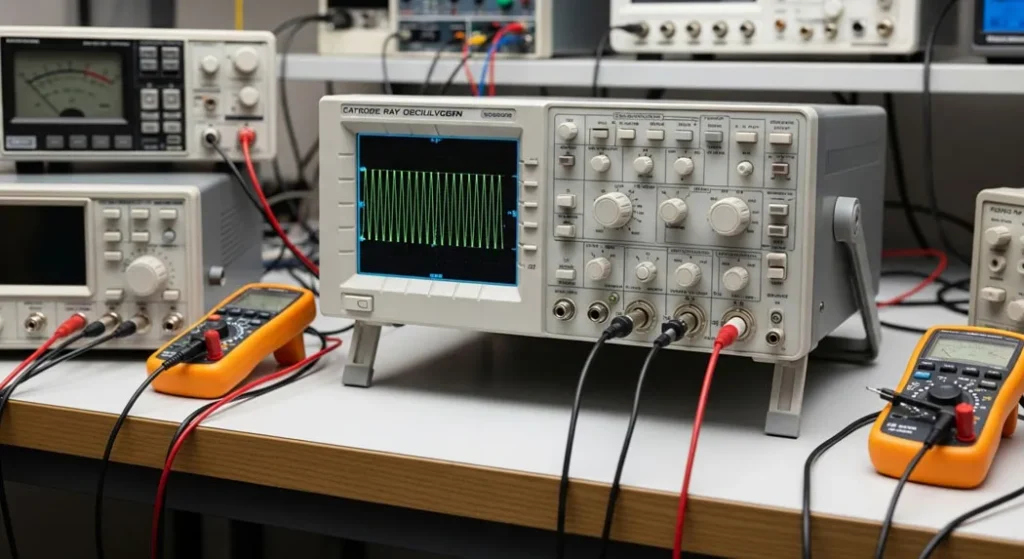
Fig 4. CRO tutorial setup proper probe connection, initial control settings, and waveform stabilization for accurate signal measurement
Set Up the CRO
Plug in and power on. Allow 1–2 minutes warm-up for older analog CROs (internal high-voltage power supply needs thermal stabilization). Adjust brightness to see a faint trace not excessively bright as this can burn the phosphor coating over time. Adjust focus until the trace appears as a sharp, thin line.
Compensate the Probe
Before any measurement, connect the probe tip to the CRO’s built-in calibration output (typically 1 kHz square wave, 1V or 5V). Observe the square wave on screen. Adjust the small trimmer capacitor in the probe (usually accessible with a screwdriver through a hole in the probe body) until the square wave has perfectly flat tops and vertical edges. Rounded tops = under-compensated; Peaked tops = over-compensated. This takes 30 seconds and eliminates major measurement errors in high-frequency work.
Connect the Probe to Your Circuit
Connect the probe tip to your circuit’s test point. Connect the probe ground clip to the circuit’s ground (0V reference) never to mains earth unless the circuit is mains-connected and you have a differential probe. For 10× probes, ensure the attenuation switch on the probe is set correctly and that the CRO’s input is set to compensate (many CROs have a switch or multiplier for probe factor).
Set Initial Volts/Div and Time/Div
Start with Volts/Div at a high setting (e.g., 5V/div) and Time/Div at a mid-range (e.g., 1ms/div). Gradually reduce Volts/Div until the waveform fills 3–5 vertical divisions for best measurement resolution. Adjust Time/Div until 2–3 complete signal cycles are visible on screen this gives enough context to measure the period accurately.
Stabilize the Waveform with Triggering
Set trigger source to CH1 (the channel you are using). Set trigger slope to rising edge (+). Slowly adjust the trigger level knob until the waveform stops moving it should “lock” into a stable display. If the waveform still moves, try the AUTO trigger mode which automatically finds a suitable trigger point. For repetitive signals, Edge triggering is almost always appropriate for beginners.
Measure the Signal Amplitude and Frequency
Amplitude: Count the number of vertical grid divisions from the lowest point of the waveform to the highest (peak-to-peak). Multiply by the Volts/Div setting. Apply probe attenuation factor if using 10× probe.
Frequency: Count the horizontal divisions for exactly one complete cycle (peak to corresponding next peak, or zero-crossing to zero-crossing at the same slope). Multiply by Time/Div to get the period T. Then f = 1/T.
Example: 4 div height × 2V/div = 8Vpp. 5 div width × 1ms/div = 5ms period → f = 1/0.005 = 200 Hz.
Beginner’s Practice Tip
Start with a 1 kHz sine wave from a function generator this is the oscilloscope training equivalent of learning to ride a bike with training wheels. The frequency and amplitude are known, so you can verify your measurement technique. Once you can consistently read the correct values (1 kHz ± 5%, amplitude ± 10%), you are ready to measure unknown circuits. Then graduate to square waves, which test your CRO’s frequency response and probe compensation, before attempting complex real-circuit signals.
What Can a CRO Measure?
Fig 5. CRO measurement capabilities from basic voltage and frequency to phase comparison, distortion analysis, and noise characterization
A CRO is like a Swiss Army knife for electronics measurement. Here is a complete list of what it can measure and how:
| Measurement | How to Measure | Formula / Method |
|---|---|---|
| Peak Voltage (Vp) | Count divisions from baseline to peak × V/div | Vp = N × (V/div) × probe factor |
| Peak-to-Peak Voltage (Vpp) | Count divisions from lowest to highest point × V/div | Vpp = Npp × (V/div) × probe factor |
| RMS Voltage (Vrms) | From Vp using waveform shape factor | Sine wave: Vrms = Vp / √2 ≈ 0.707 × Vp |
| DC Voltage | Set input coupling to DC; measure vertical shift from GND reference line | VDC = Ndiv from GND × (V/div) |
| Frequency | Measure period of one complete cycle horizontally | f = 1/T = 1/(Ndiv × t/div) |
| Period | Count horizontal divisions for one complete cycle | T = Ndiv × (t/div) |
| Rise Time / Fall Time | Measure time between 10% and 90% points of a step edge | tr = measured time (compare to CRO’s own tr) |
| Phase Difference | Dual channel: measure horizontal shift between two signals at same frequency | φ = (tshift/T) × 360°; or use X-Y Lissajous |
| Frequency Ratio | X-Y mode: count tangent points on Lissajous figure | fy/fx = tangent-Y / tangent-X |
| Noise & Glitches | AC coupling + high V sensitivity; use single-shot trigger for glitches | Observe Vpp of noise floor; capture single-event glitches |
Applications of a Cathode Ray Oscilloscope
Fig 6. CRO applications from student electronics labs and audio engineering to medical ECG signal monitoring, telecommunications testing, and industrial circuit debugging
| Application Domain | How CRO Is Used | Key Measurement |
|---|---|---|
| Electronics Education Labs | Visualizing AC waveforms, RC time constants, amplifier gain | Waveform shape, amplitude, frequency, phase |
| Circuit Debugging | Finding clipping in amplifiers, signal distortion, unwanted oscillations | Waveform shape comparison, harmonic content |
| Audio Engineering | Checking amplifier linearity, verifying speaker crossover behavior | THD (total harmonic distortion), frequency response |
| Medical Equipment | Verifying ECG waveform shape, pacemaker pulse timing, ultrasound signal | Pulse width, amplitude, timing accuracy |
| Telecommunications | Testing signal quality in telephone/internet lines, RF modulation depth | Modulation index, signal-to-noise ratio |
| Power Electronics | Checking power supply ripple, switching waveforms, dead-time in inverters | Ripple voltage, switching transitions, duty cycle |
| Automotive Electronics | Ignition timing, fuel injector pulse width, CAN bus signal shape | Timing, pulse width, voltage levels |
Using a CRO to Diagnose Audio Distortion
A guitar amplifier was producing harsh-sounding distortion. The technician connected a CRO across the amplifier’s output, fed in a 1 kHz sine wave at progressively increasing levels, and observed the waveform.
At low input levels: clean sine wave output no distortion. As input increased: the top and bottom of the sine wave began to flatten symmetrical clipping from the output stage transistors reaching saturation. The CRO revealed the exact clipping onset voltage (±16V) indicating the output stage biasing was correct for the supply voltage.
Further investigation with the CRO in dual-channel mode (input on CH1, output on CH2) revealed the phase shift at high frequencies, confirming negative feedback stability margin. The diagnosis: the amplifier was operating correctly within its power limits the “distortion” was the user pushing the amp into normal saturation, not a fault condition.
Troubleshooting, Calibration & Industry Standards
CRO Troubleshooting Guide
Standards Governing Oscilloscope Safety and Accuracy
CAT I: Low-energy equipment (signal circuits, battery circuits)
CAT II: Single-phase mains socket-connected equipment (most household appliances)
CAT III: Three-phase distribution and fixed mains installations
CAT IV: Utility service entrance, meters, primary overcurrent protection
Most student CROs are rated CAT I or CAT II. Using a CAT I oscilloscope to measure directly on mains wiring (CAT III/IV) can result in catastrophic arc flash or electrocution if a transient overvoltage occurs. Always verify the CAT rating stamped on your oscilloscope or probe before making measurements.
| Standard | Organization | Scope |
|---|---|---|
| IEC 61010-1 | IEC (International) | Safety requirements for electrical equipment for measurement, control, and laboratory use protects users from high-voltage hazards in oscilloscopes |
| IEEE Std 1057 | IEEE | Governs testing and calibration procedures for digitizing waveform recorders accuracy of timebase, vertical gain, and noise characterization |
| ISO Calibration | ISO (International) | Regular ISO-traceable calibration ensures oscilloscope measurements reference national standards essential for professional engineering and compliance testing |
| IEC 61326-1 | IEC | EMC requirements for measurement equipment ensures oscilloscopes do not interfere with other equipment and are immune to external electromagnetic interference |
Tips for Using a CRO Like a Pro
- Start with a known signal: Use a function generator to create a 1 kHz sine wave with a known amplitude to practice adjusting controls and verify measurement technique before working with unknown circuits
- Check your probe setting first: Always confirm probe attenuation (1× or 10×) before reading amplitude. A 10× probe on a 2V/div setting means 20V/div effective a common source of 10× measurement errors
- Compensate before every session: Probe compensation can drift with temperature. Take 30 seconds to compensate every time you use the CRO especially important for high-frequency or pulse measurements
- Never exceed maximum input voltage: Check your CRO manual for the maximum input voltage (typically 300V DC+peak or 400V CAT II). Exceeding this destroys the vertical amplifier input a costly repair
- Use AC coupling for ripple measurements: Set input coupling to AC when measuring small AC ripple on a large DC rail the DC component is blocked, allowing you to expand V/div for better ripple resolution
- Dual channel for phase measurement: Enable both channels simultaneously, connect the same V/div and Time/Div settings, and align their ground references (press GND on each and verify they are on the same horizontal line) before measuring phase difference between two signals
- Practice reading waveforms: Spend time with sine, square, and triangle waves from different sources to develop intuition for spotting distortion, asymmetry, and noise
- Fun Experiment Voice Waveform: Connect a CRO to a microphone preamplifier circuit and speak into it. Watch the waveform change with different vowels and consonants this is one of the most visual demonstrations of analog signal behavior available to beginners
The History of CROs: Karl Braun to Digital Scopes
| Year | Milestone | Significance |
|---|---|---|
| 1897 | Karl Ferdinand Braun invents the Cathode Ray Tube | Nobel Prize 1909 (shared with Marconi). The foundational display technology for CROs |
| 1920s–30s | Practical CRO instruments developed by Tektronix pioneers | First vacuum tube-based oscilloscopes become available for laboratory use |
| 1946 | Tektronix founded; Model 511 oscilloscope released | First commercially practical triggered oscilloscope standardizes the CRO concept |
| 1950s–60s | CROs become standard in every electronics laboratory | Bandwidth extends to MHz range; dual-channel operation introduced |
| 1970s–80s | Bandwidth reaches 100–500 MHz for analog CROs | High-performance CROs enable semiconductor R&D and telecommunications testing |
| 1985 | First digital storage oscilloscopes (DSOs) introduced | ADC-based digital capture enables waveform storage, math, and extended analysis |
| 2000s–2026 | DSOs dominate; CROs remain in education and analog labs | DSO bandwidths exceed 100 GHz for research; CROs valued for pure analog display and affordability |
Getting Started with Your Own CRO
If you are ready to own and use a CRO, here is a practical guide to getting started:
Finding a CRO
Look for used models on eBay, electronics surplus stores, or university equipment sales. Recommended brands for beginners: Tektronix (USA), Rigol, Siglent, and Hantek. Prices for basic used analog CROs range from $50–$300 for a functional unit. Entry-level new digital oscilloscopes (Rigol DS1054Z, Hantek DSO5102P) are available for $100–$250 and offer significantly more features worth considering if your budget allows.
Essential Accessories to Buy
- Passive probes (10× recommended): Most CROs include probes, but ensure you have matched, compensated probes. $15–$30 per probe.
- Function generator: Essential for generating test signals to practice with. Entry-level signal generators: $30–$100.
- BNC connectors and adapters: For connecting standard test equipment. $5–$15 kit.
First Experiments
Battery and Resistor DC Measurement
Connect the probe to a 9V battery through a 1kΩ resistor to ground. Set coupling to DC. Verify you see a flat horizontal line at 9V (or close to it). This confirms the CRO is measuring DC correctly and the probe ground is properly connected.
Function Generator Sine Wave
Connect a function generator set to 1 kHz, 5Vpp sine wave. Measure the frequency and amplitude. Verify your readings match the generator settings within ±5%. This validates your measurement technique.
RC Circuit Time Constant
Build a simple RC circuit (10kΩ + 10µF). Apply a square wave from a function generator. Observe the exponential charge/discharge curve. Measure the time constant τ = RC ≈ 100ms. Compare to your measured value excellent practice for all three core CRO measurements: time, voltage, and waveform shape.
Voice Waveform Visualization
Connect a microphone preamplifier to the CRO and speak different vowel sounds. Observe how “aaaaah” produces a complex periodic waveform while “ssssss” produces aperiodic noise-like signals. This is one of the most intuitive demonstrations that the CRO is truly displaying real-world physical phenomena as electrical signals.
Fun tip: Share your oscilloscope captures with our community drop your results in the comments below!
Conclusion: The CRO A Window Into the World of Electronics
A cathode ray oscilloscope might seem complex at first, but it is really a beautifully elegant tool with a clear purpose: helping you see and understand electrical signals. From its electron-shooting CRT to its user-friendly graticule controls, the CRO provides a direct, analog, real-time window into circuit behavior that no multimeter can match.
Whether you are measuring voltages with S = D/V, calculating frequencies with f = 1/T, determining CRO suitability using BW ≈ 0.35/tr, or analyzing phase with Lissajous figures every formula in this guide serves a direct, practical measurement purpose. The safety standards (IEC 61010), accuracy standards (IEEE 1057), and calibration protocols are not bureaucratic formalities they protect you from electrocution and your measurements from systematic errors.
Grab a probe, fire up your oscilloscope, and start discovering the hidden rhythms of your circuits! Want more? Check out our related electronics tutorials below. Try connecting a CRO to a microphone circuit and share your voice waveform results in the comments!
Frequently Asked Questions About CROs
Deflection sensitivity (S) is the vertical displacement of the electron beam on the phosphor screen for every one volt applied to the vertical deflection plates. It is calculated as: S = D/V (mm/V), where D is the beam displacement in millimeters and V is the input voltage in volts. Higher sensitivity means a larger displacement per volt better for measuring small signals. It is set by the Volts/Div knob: at 1V/div with 10mm/div graticule, S = 10mm/1V = 10 mm/V.
A CRO provides real-time, direct visualization of analog signals without digital processing intermediation. This makes it ideal for teaching because: (1) it shows the “pure” signal waveform students see exactly what the circuit is doing; (2) the physical controls (Volts/Div, Time/Div, Trigger) have clear, direct functions that teach measurement principles; (3) it does not sample signals, so it cannot miss fast transients or introduce aliasing artifacts; (4) learning the CRO teaches measurement fundamentals that apply equally to understanding modern DSOs.
A CRO is an analog instrument that displays signals directly on a phosphor screen using a deflected electron beam bandwidth up to ~100 MHz, infinite vertical resolution, cannot store waveforms. A DSO converts signals to digital data using an Analog-to-Digital Converter (ADC) at high sample rates bandwidths typically exceed 1 GHz, enables waveform storage, mathematical analysis, pre-trigger capture, and protocol decoding. DSOs dominate industry; CROs remain important for education, analog signal work, and budget-conscious users.
Safety is primarily governed by IEC 61010-1 the international standard for electrical measurement, control, and laboratory equipment. It defines four measurement installation categories (CAT I–IV) based on the energy level at the measurement point. Your oscilloscope and probes must be rated for the CAT category of the circuit you are measuring using undersized equipment on mains circuits risks fatal arc flash. IEEE Std 1057 governs accuracy and calibration procedures for digital waveform recorders.
X-Y mode bypasses the internal time base generator and plots one external signal on the horizontal axis (X) against another on the vertical axis (Y) instead of plotting voltage vs. time. The result is a Lissajous Figure a geometric pattern that encodes the frequency ratio and phase difference between the two signals. It is used for: measuring phase difference between signals (e.g., comparing input to output of a filter), determining frequency ratios (fy/fx = tangent-Y/tangent-X), displaying component I-V characteristics (current vs. voltage curve), and phase-locked loop verification.
Step 1: Stabilize the waveform with proper triggering. Step 2: Count the number of horizontal grid divisions for exactly one complete cycle (from peak to next identical peak, or zero-crossing to next zero-crossing at the same slope direction). Step 3: Multiply the division count by the Time/Div setting to get the period T. Step 4: Calculate frequency: f = 1/T. Example: 5 divisions at 2ms/div → T = 5 × 2ms = 10ms = 0.01s → f = 1/0.01 = 100 Hz.
A blurry or thick trace has several possible causes: (1) Incorrect Focus adjust the Focus control until the trace is the thinnest possible line; (2) Excessive Brightness reduce Intensity control; (3) High-frequency noise on the signal or power supply use bandwidth limit (BW Limit) filter if available; (4) Poor probe ground connection verify the probe ground clip is properly connected to circuit ground; (5) Incorrect beam astigmatism some CROs have an internal astigmatism control requiring adjustment. Start with Focus and Intensity before seeking other causes.
Triggering synchronizes the start of the horizontal sweep with a specific, repeatable point on the signal typically when the signal crosses a set voltage level (trigger threshold) in the chosen direction (rising or falling edge). Without stable triggering, each horizontal sweep starts at a different point in the signal cycle, causing the waveform to appear to “run” or “drift” continuously across the screen making measurement impossible. Correct triggering makes periodic signals appear stationary for easy measurement. The trigger can be derived from CH1, CH2, an external signal, or the power line (useful for measuring mains-frequency-related phenomena).
Probes contain internal capacitance (typically 10–18 pF) that must precisely match the CRO’s input capacitance for flat frequency response. A trimmer capacitor in the probe body adjusts this match. If not compensated: at high frequencies, the capacitive divider ratio changes, causing measurement errors. Over-compensated: square wave tops show overshoot and ringing high-frequency signals appear larger than they are. Under-compensated: square wave tops are rounded high-frequency components are attenuated. Always compensate using the CRO’s built-in 1 kHz square wave calibration output until you see perfectly flat tops with sharp vertical edges.
Yes. Set the input coupling switch to DC (not AC, which blocks the DC component). The baseline horizontal trace shifts vertically from the ground reference line by an amount proportional to the DC voltage. Measure the vertical displacement in divisions and multiply by the Volts/Div setting (and probe attenuation factor). Example: 3 divisions upward shift at 5V/div with 1× probe → VDC = +15V. For measuring small AC ripple on a large DC supply, switch to AC coupling after noting the DC level this blocks the DC and lets you expand V/div sensitivity to see the ripple.
📚 Continue Learning on Procirel
Anonymous (January 25, 2026) “What i do not realize is actually how you’re not actually much more well-liked than you may be now…”
📎 Technical References
- 1Wikipedia Oscilloscope Historical development, CRT technology, and measurement principles [Reference]
- 2Geeks for Geeks Cathode Ray Oscilloscope Technical overview and component descriptions [Reference]
- 3SlideShare Cathode Ray Oscilloscope Detailed engineering presentation [Reference]
- 4IEC 61010-1:2010+AMD1:2016 Safety Requirements for Electrical Equipment for Measurement, Control, and Laboratory Use IEC CAT I–IV measurement category safety requirements [International Standard]
- 5IEEE Std 1057-2017 IEEE Standard for Digitizing Waveform Recorders IEEE Accuracy, timebase, and vertical gain calibration requirements [IEEE Standard]
- 6Tektronix XYZs of Oscilloscopes: A Primer Tektronix Application Note Comprehensive oscilloscope operation reference [Manufacturer Reference]
- 7Cooper, W.D. & Helfrick, A.D. Modern Electronic Instrumentation and Measurement Techniques Prentice Hall CRT physics, deflection sensitivity, and measurement theory [Academic Textbook]
- 8Golnabi, H. “Design and Operation of a CRO Measurement System” Scientia Iranica, 2011 Experimental validation of CRO performance formulas [Academic Paper]